4513.0 - Criminal Courts, Australia, 2016-17  Quality Declaration
Quality Declaration ARCHIVED ISSUE Released at 11:30 AM (CANBERRA TIME) 28/02/2018
Page tools:
 Print Page Print Page
 Print All Print All
| ||
AUSTRALIAN CAPITAL TERRITORY DEFENDANTS FINALISED In 2016–17, there were 5,385 defendants finalised in the Australian Capital Territory criminal courts, an increase of 805 defendants (18%) on the previous year. This was the largest percentage increase across the states and territories. (Tables 15 to 43) The rate of defendants finalised was 1,524 per 100,000 persons aged 10 years and over. (Table 55) 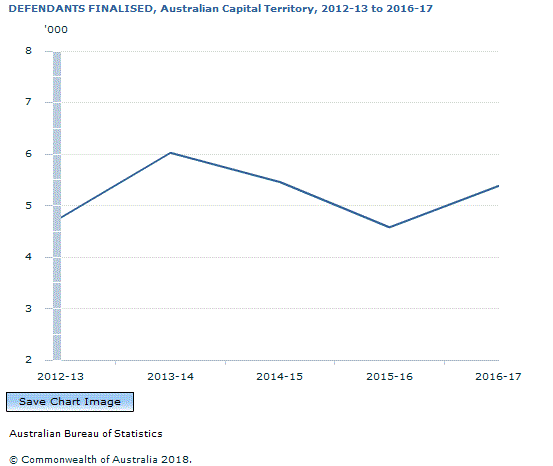 Source(s): Criminal Courts, Australia Defendants finalised in the Australian Capital Territory comprised less than one per cent of all defendants finalised nationally in 2016–17. (Table 2) PRINCIPAL OFFENCE In 2016–17, the most common principal offences for defendants finalised in the Australian Capital Territory were:
COURT LEVEL Of the 5,385 defendants finalised in the Australian Capital Territory in 2016–17:
METHOD OF FINALISATION Of the 5,385 defendants finalised in the Australian Capital Territory in 2016–17:
Between 2015–16 and 2016–17, the number of defendants who had their matter(s) withdrawn by prosecution increased by 49% (480) following on from a 32% decrease (449) between 2014–15 and 2015–16. (Table 43) The Australian Capital Territory had the highest proportion of defendants who had their matter(s) withdrawn by the prosecution across the states and territories (27% or 1,452). (Table 2) 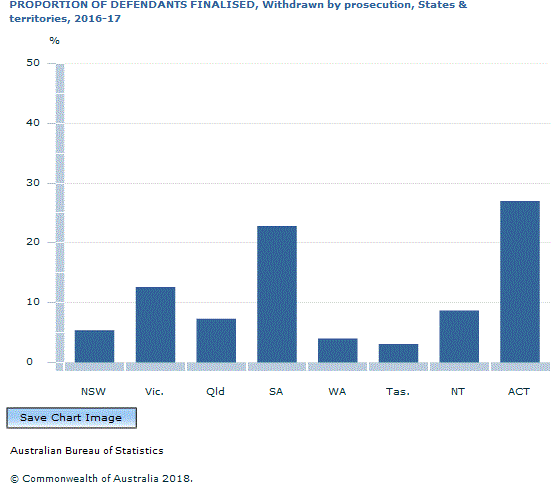 Source(s): Criminal Courts, Australia PRINCIPAL SENTENCE Of the 3,520 defendants who were proven guilty:
OTHER KEY POINTS In 2016–17:
Document Selection These documents will be presented in a new window.
|
||
